The problem
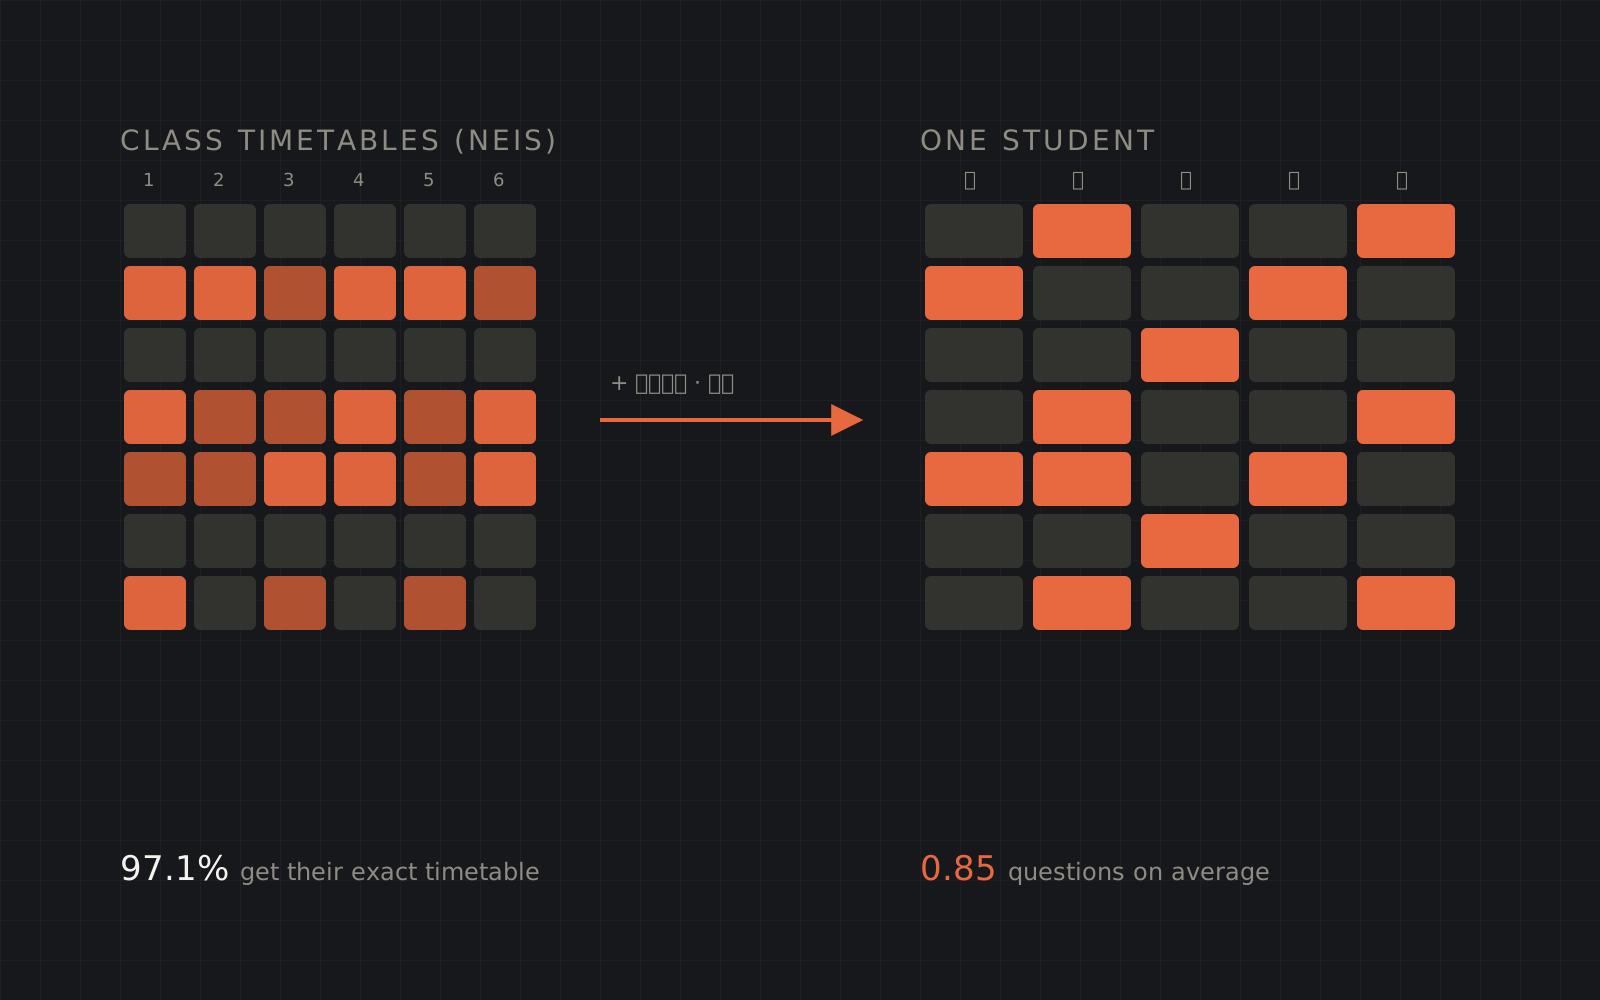
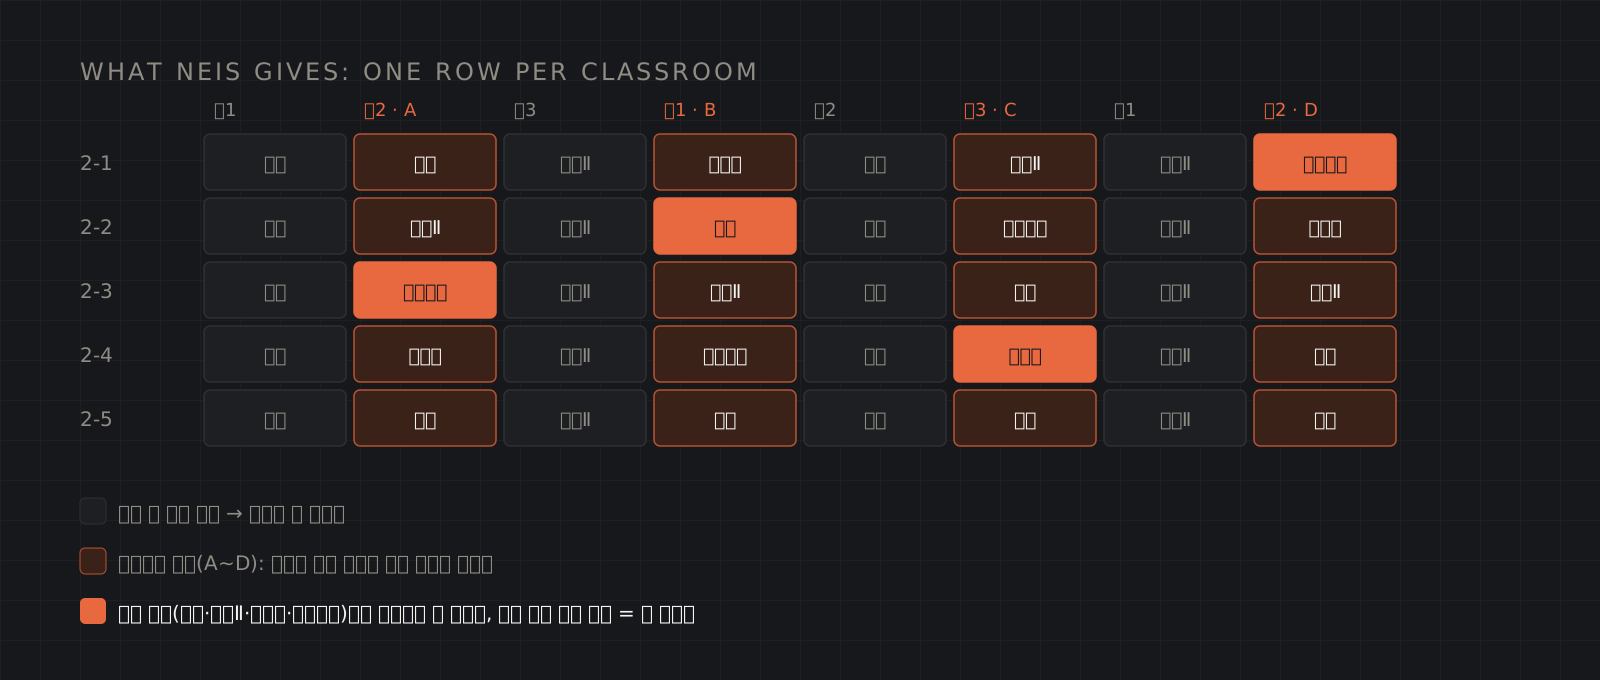
Since Korea’s credit-based high-school system, students in the same homeroom take different electives and so have different timetables. The public school data (NEIS) only records what happened in each classroom; nothing says which student is in which section. Students had to type 20 to 35 cells a week by hand.
This engine replaces that with “upload a photo of the timetable your school gave you” or “pick the electives you take”. It powers the timetable feature of Timeroute.
How it works
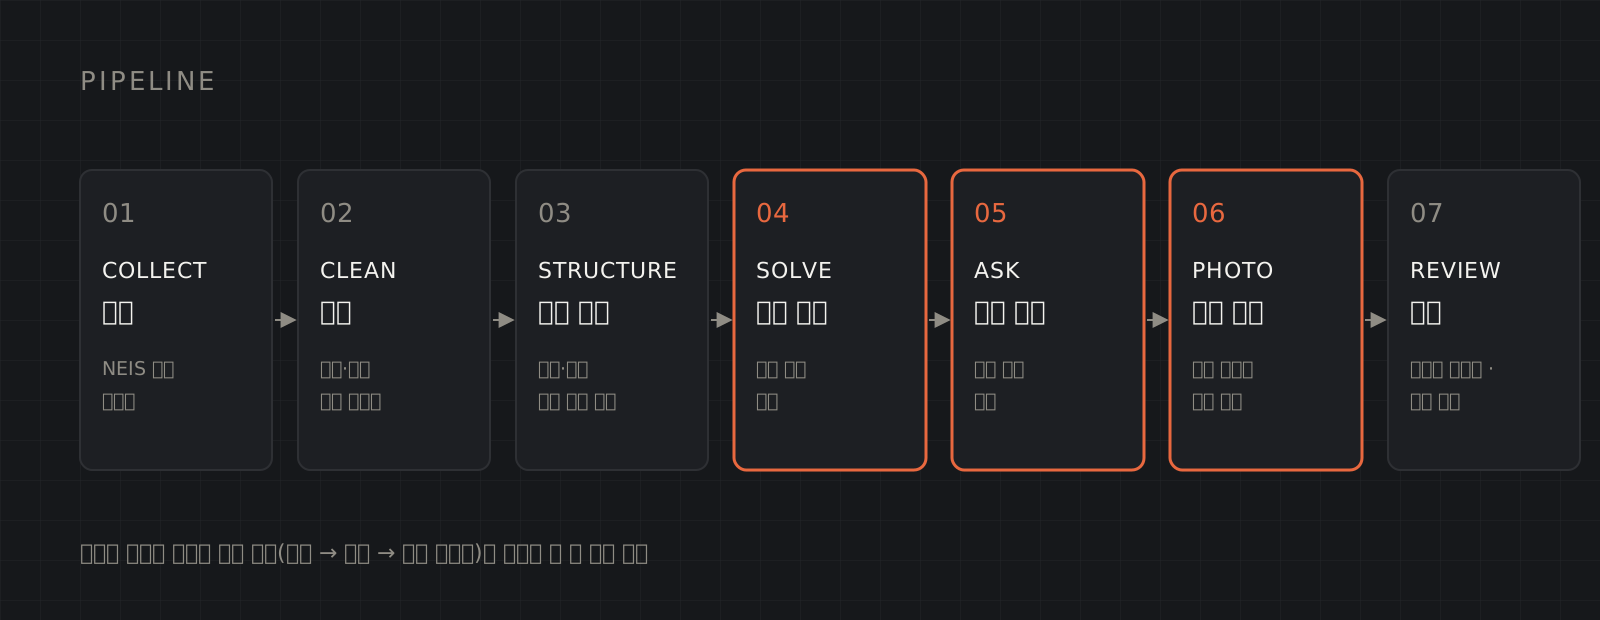
- Collect. Grade timetables that schools publish on NEIS, over a long enough period to work even right after term starts.
- Clean. Exams, events, holidays and one-off lesson swaps are filtered out to get the grade’s standard week.
- Infer structure. Grade-wide lessons, per-class lessons and elective sections are told apart, and the engine works out which way each school organises its electives.
- Search. It finds the combinations of sections that fill every free period with the student’s chosen subjects. Periods the student marks as free are left empty.
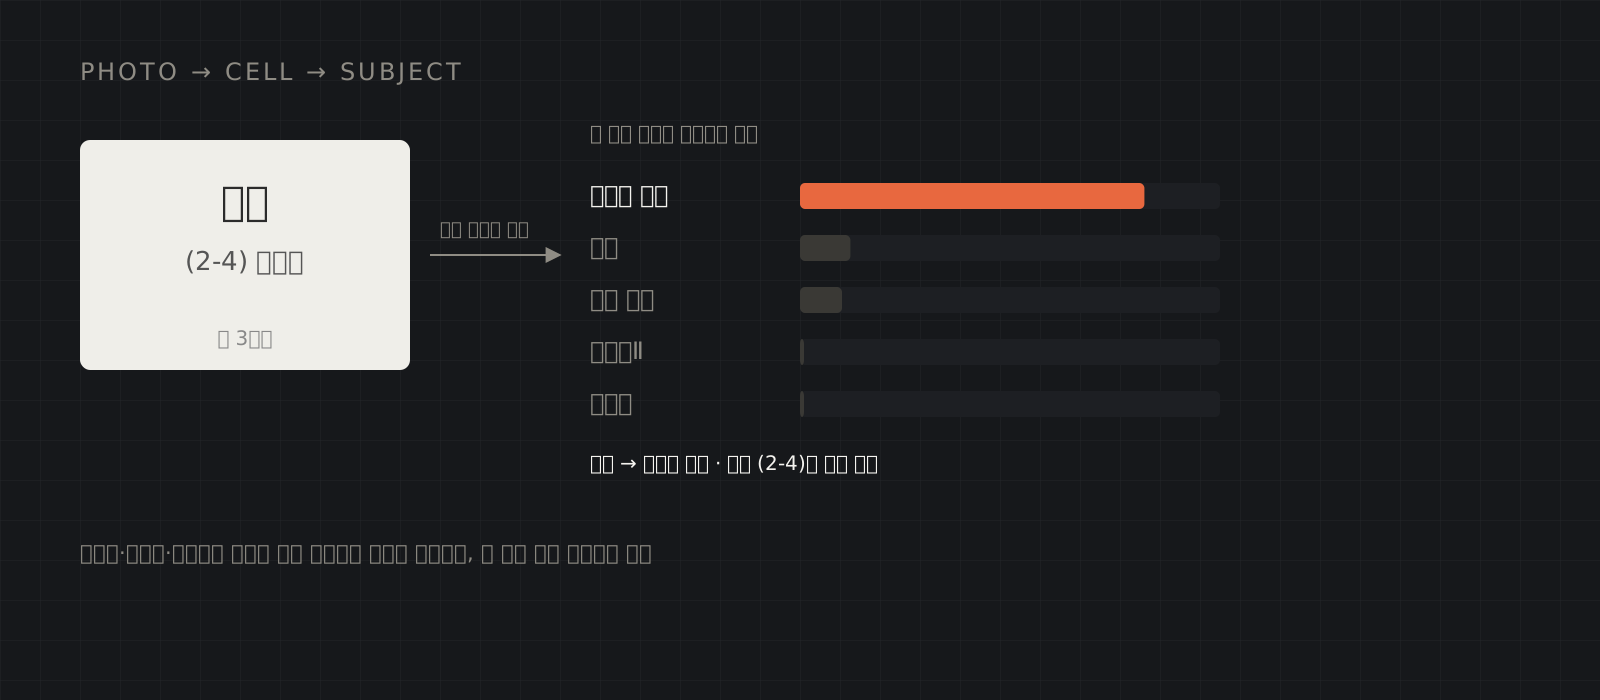
- Ask. If several timetables remain, one or two well-chosen questions settle it, for example “tap a period where you have Probability and Statistics”.
- Read a photo. A photo of the school-issued timetable is read on the device and checked against the school’s own data to fix abbreviations, handwriting and misreads.
- Review. Any cell can be tapped and corrected, and when nothing fits the engine explains why.
Reading photos
School-issued timetables are full of abbreviations, sometimes handwritten, often photographed at an angle. What plain text recognition gets wrong is corrected against the school’s real timetable data, and unread cells and classrooms are filled in by inference. Photos never leave the device.
Free periods
The engine’s strongest clue is “no gaps before the end of the day”. Students with a free period in the middle of the day therefore got no answer or a wrong one. Dropping the rule would make every empty cell ambiguous (a free period, or a section the student did not pick?) and multiply the candidates and questions.
So the rule stays, and the student taps a free cell once. The engine clears the other hours of the same elective group with it and fills the rest as before. Simulated students with a free period went from 4.9% to 97.8% reaching their exact timetable, with 1.6 taps on average; students without one get the same results as before. On photos, completely blank cells are used as free-period candidates.
What changed for students
|
Before: manual entry |
Now |
| What the student does |
Makes a card (subject, room) for each subject and places it cell by cell |
One photo, or picking their electives |
| Taps |
about 95 |
about 6 (photo) or 10 (electives) |
| Typing |
about 93 characters of subjects and rooms |
a few letters to find the school |
| Elective rooms |
written by the student |
filled in automatically |
| New term |
start over |
one new photo |
Taps are counted along the app’s screens using the average timetable in the 600-timetable benchmark (32.4 lessons and 12.6 subject-room pairs a week).
Validation
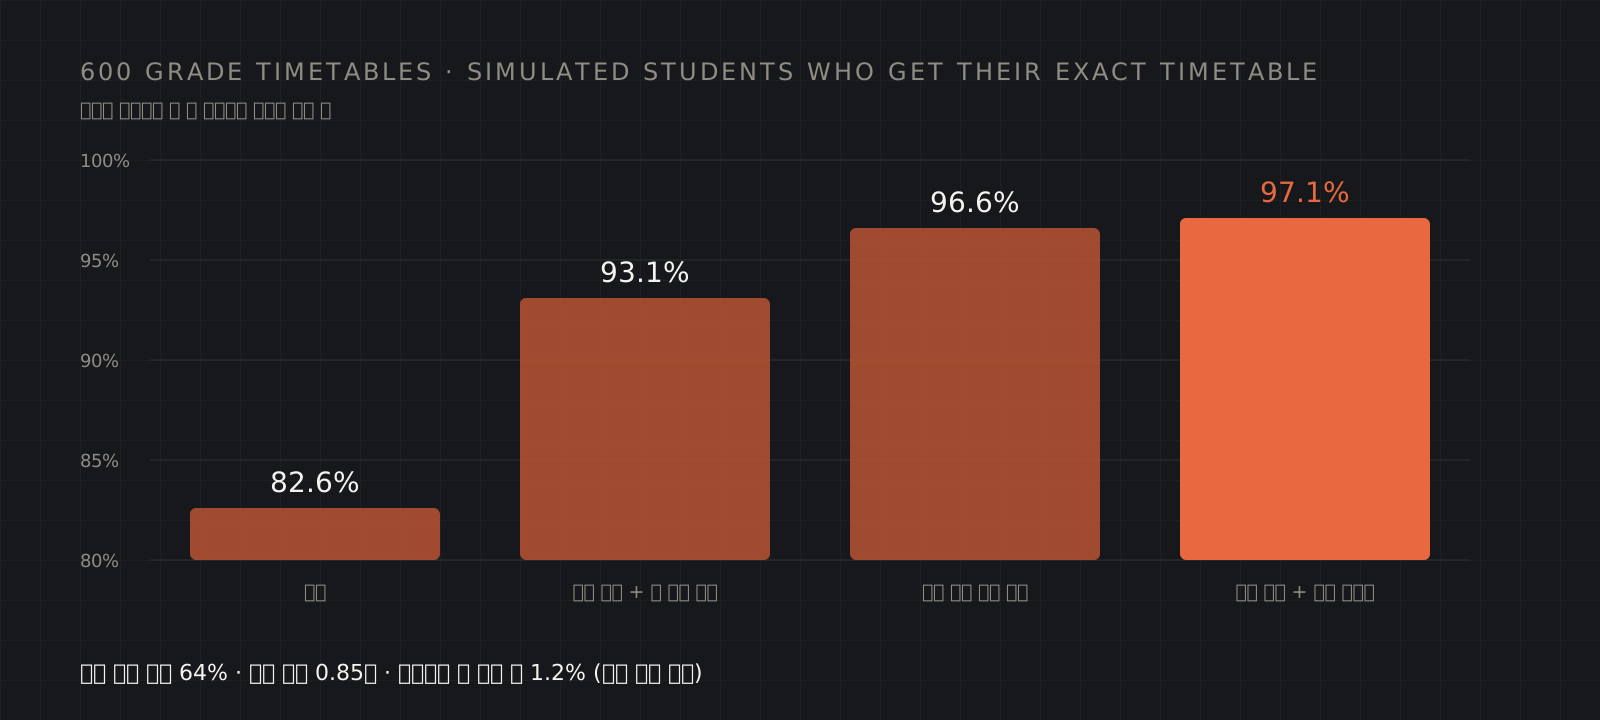
A fixed benchmark of 600 grade timetables (grades 1 to 3 at 200 schools, sampled across education offices and school types out of 2,353) was used to compare every change before and after.
| Metric |
Value |
| Simulated students who get their exact timetable (including classes the engine could not start on) |
97.1% |
| Finished with no question |
64% |
| Questions on average |
0.85 |
| Students with a free period (before → after marking it) |
4.9% → 97.8% |
| Classes the search cannot solve |
1.2% |
| Noise subject names after cleaning |
~1,300 → near 0 |
The unsolved 1.2% are classified by cause: schools that entered elective-group codes as class names, schools that left elective periods out of NEIS, final-year afternoons that change weekly, and a science high school run almost entirely in special rooms. Those students fall back to the photo or manual path.
Limits. Simulated students are built within the structure the engine believes in, so the figures measure internal consistency rather than accuracy against real students. Photo reading was checked on four rendered timetables and one real printed and handwritten timetable. Tap counts are calculated, not timed with users. Collecting real timetables as ground truth is the next step.
Design principles
- Minimal personal data. Photos stay on the device; only public data is used
- Data integrity. No crowd-sourced values shared between users, so no one can corrupt another student’s result
- Always a way through. Photo, then electives and questions, then free-period marks, then manual editing
- Measured changes. Every change compared on the same benchmark
Where else it applies
The pattern is “incomplete public or legacy data + minimal input or a document photo → a verified personal result”. For a private academy, for example:
- Exam-prep schedules per school from each school’s calendar and exam dates
- Class scheduling without clashes, given students’ school timetables and finishing times, teachers’ availability and rooms
- Local demand for electives, from the electives and section counts nearby schools actually run
- Document photos to records: enrolment forms, report cards and timetables read into the student system with subject names normalised
- Parent notices drafted per class once exam scope and dates are set
Details
- Own project, 2026. Used in the Timeroute iOS app
- TypeScript · React · Supabase Edge Functions · Swift (Apple Vision) · Vitest